See the whole build.

Fiber sales runs on areas, contractors and lead lists. Terros puts all three on one live map — with the penetration and activity numbers to manage them.

Built for ISPs and the vendor teams selling for them — residential and commercial field sales.
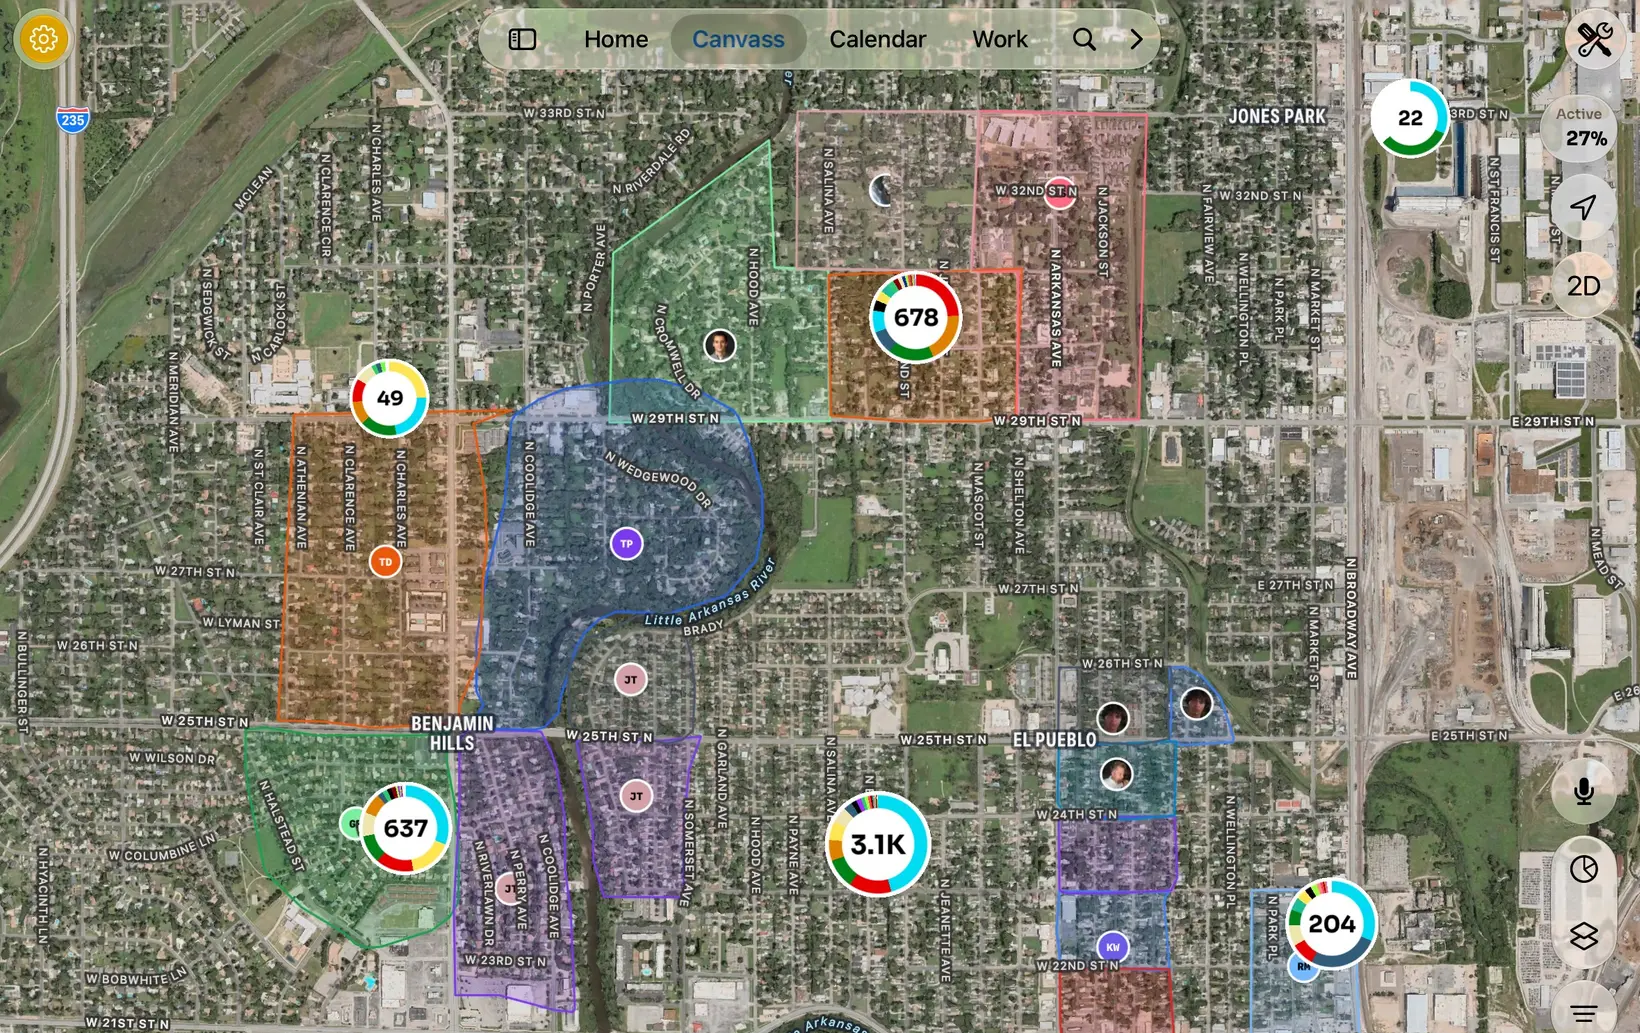
Canvass areas drawn over a satellite map, each with its owner and a ring of how many accounts have been worked

Areas & teams

Every crew gets a lane.

Draw areas in bulk and assign them to teams, contract partners or individual reps. As install crews move between areas, reassignment takes minutes — not a spreadsheet session.

check

Bulk draw, assign and reassign areas

check

Built for contract-partner crews

check

Reassign turf as the build moves

check

Do-not-knock lists enforced on every device

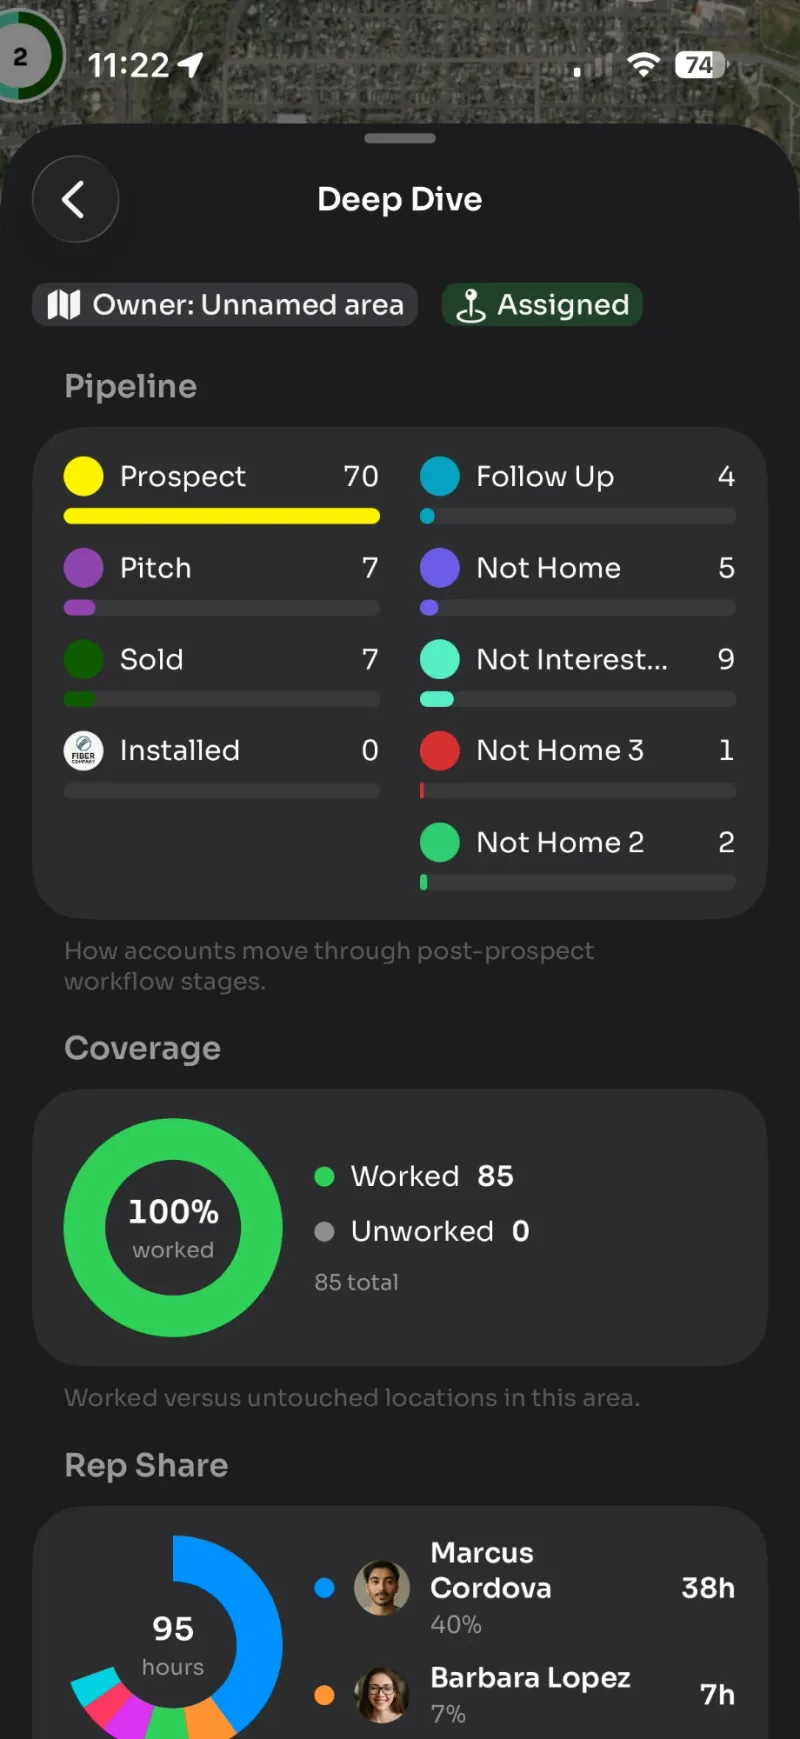
Deep Dive for an area: pipeline stage counts and coverage, with every location worked
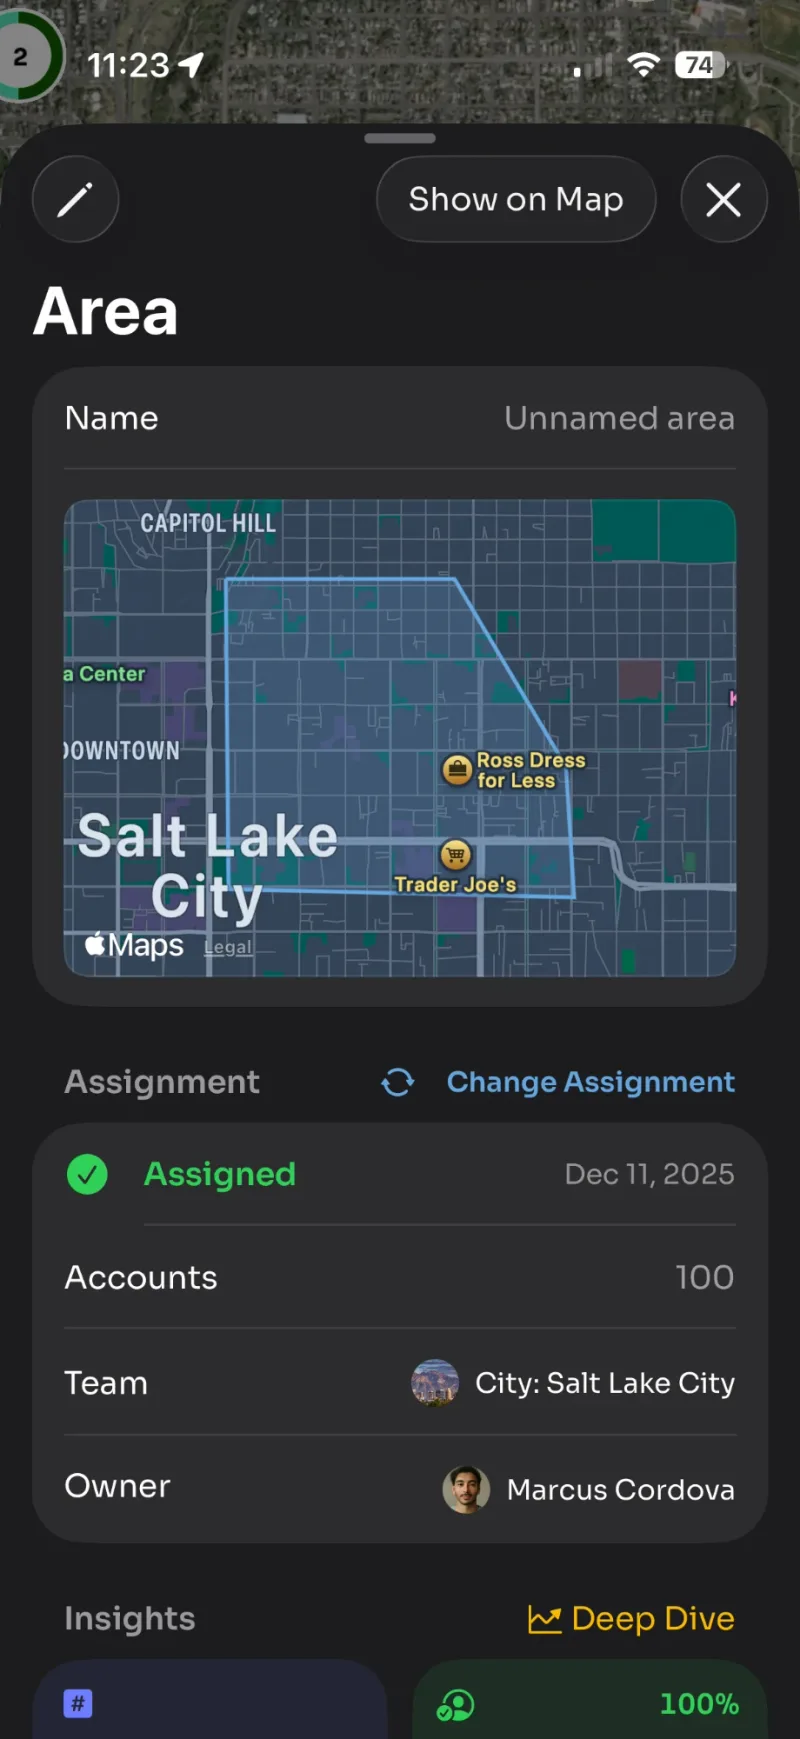
An area in Terros showing its boundary on the map with the team and owner it is assigned to
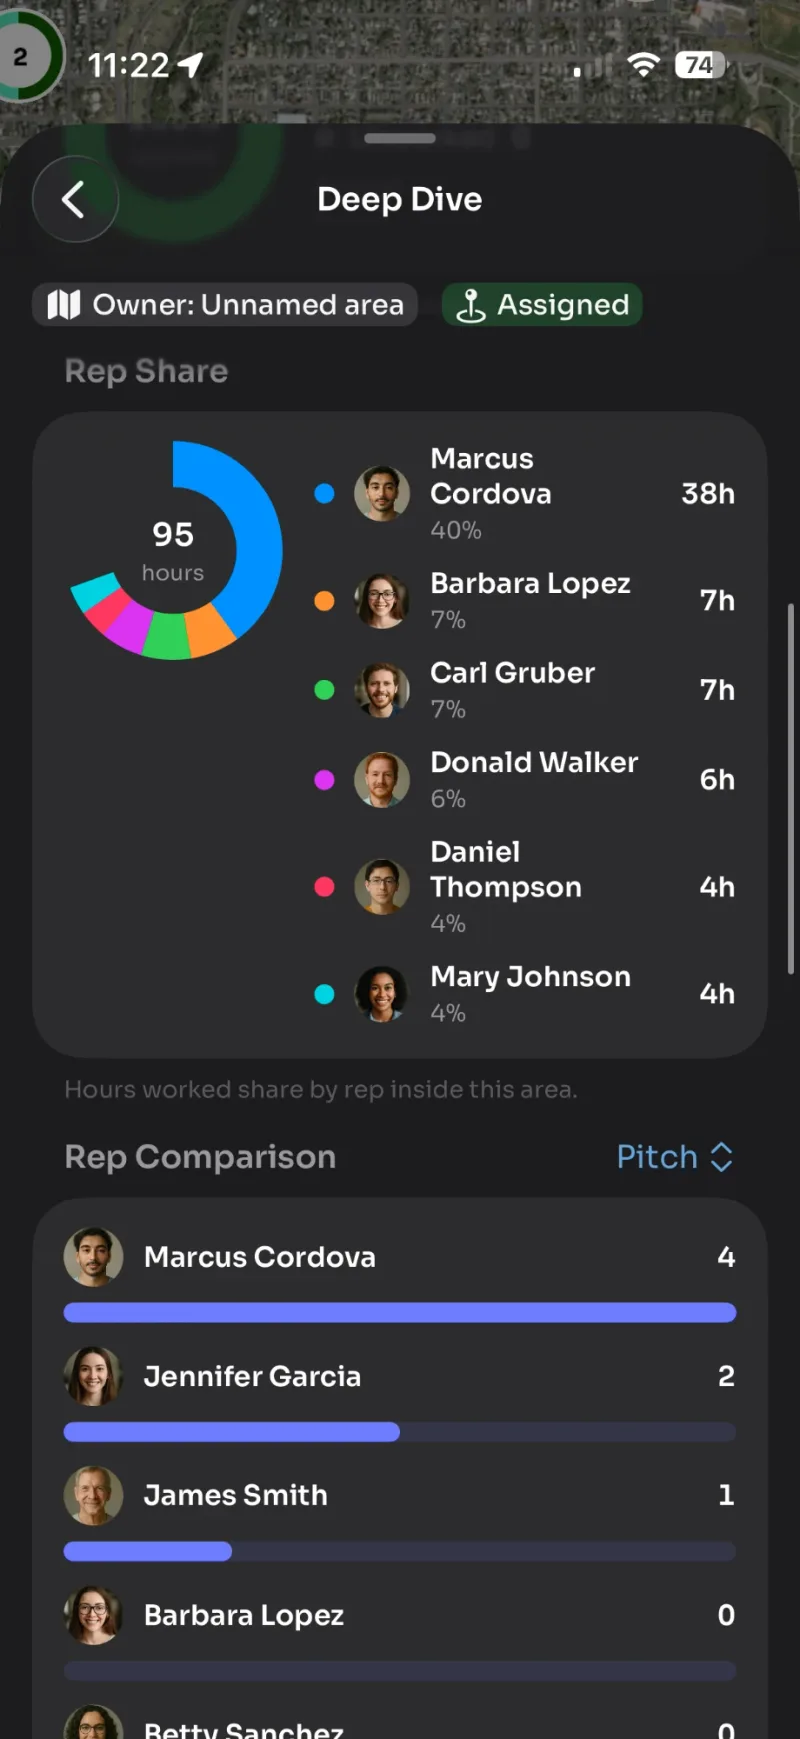
Hours worked by each rep inside the area, with a per-rep comparison beneath

Leads

Import the list. Knock the list.

Load your addresses and each one becomes a pin — the whole file at once, with no row caps and no splitting it into batches. Reps work exactly the doors on the list, down to the unit in an MDU.

check

Import the whole list — no row caps, unit numbers included

check

Reassignment keeps the lead’s full history

check

Time-boxed lists expire on their own

check

Account pipeline for the multi-touch install

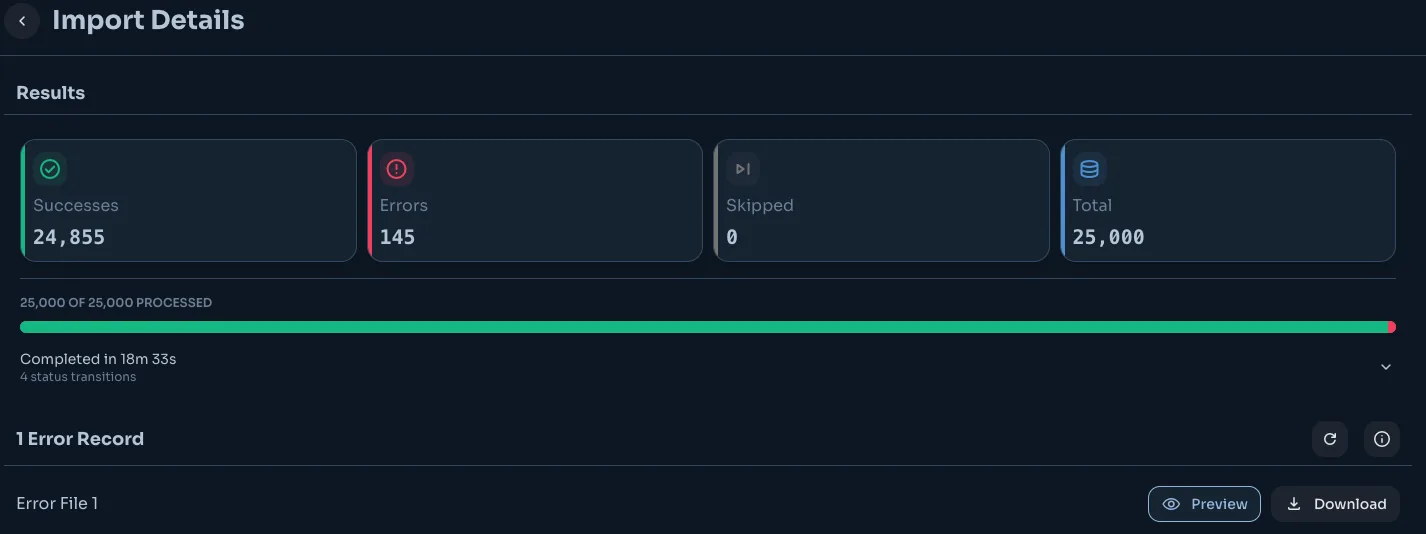
Import details for one list: 25,000 records processed in a single run, 24,855 successes

Offline

No signal? Keep knocking.

Fiber routes run through places the internet has not reached yet — that is the point. Terros stores the whole day on the phone and syncs the moment the truck finds bars.

check

Offline mode built specifically for fiber routes

check

Every knock and disposition stored locally

check

Automatic sync on reconnect

check

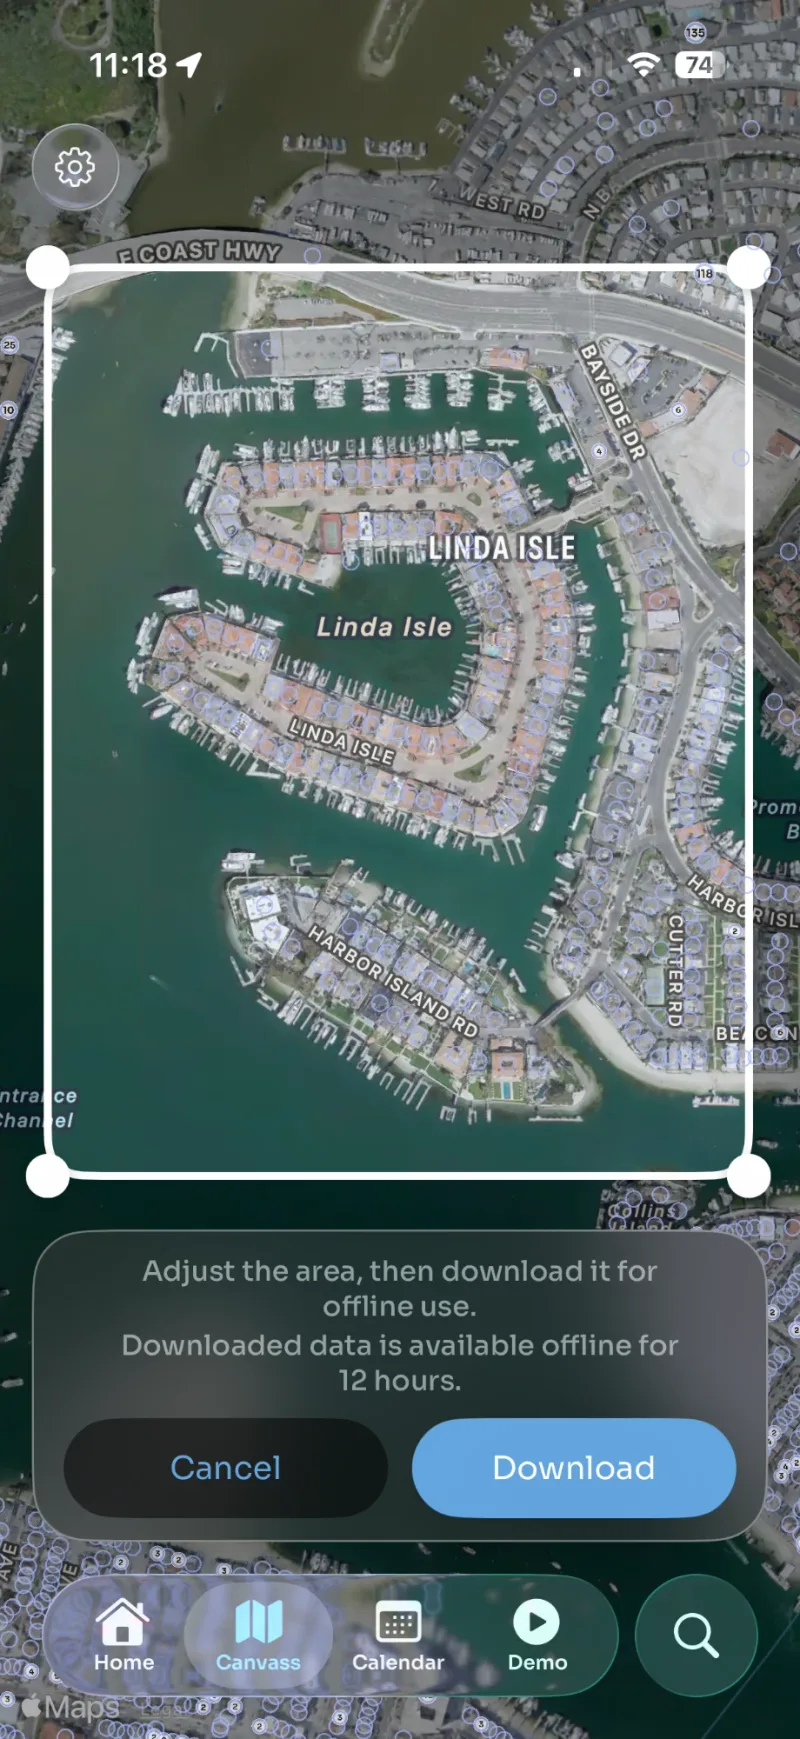
Maps downloaded before the crew rolls out

Selecting a map area on a phone to download it for offline use

Penetration

Know how deep every area is worked.

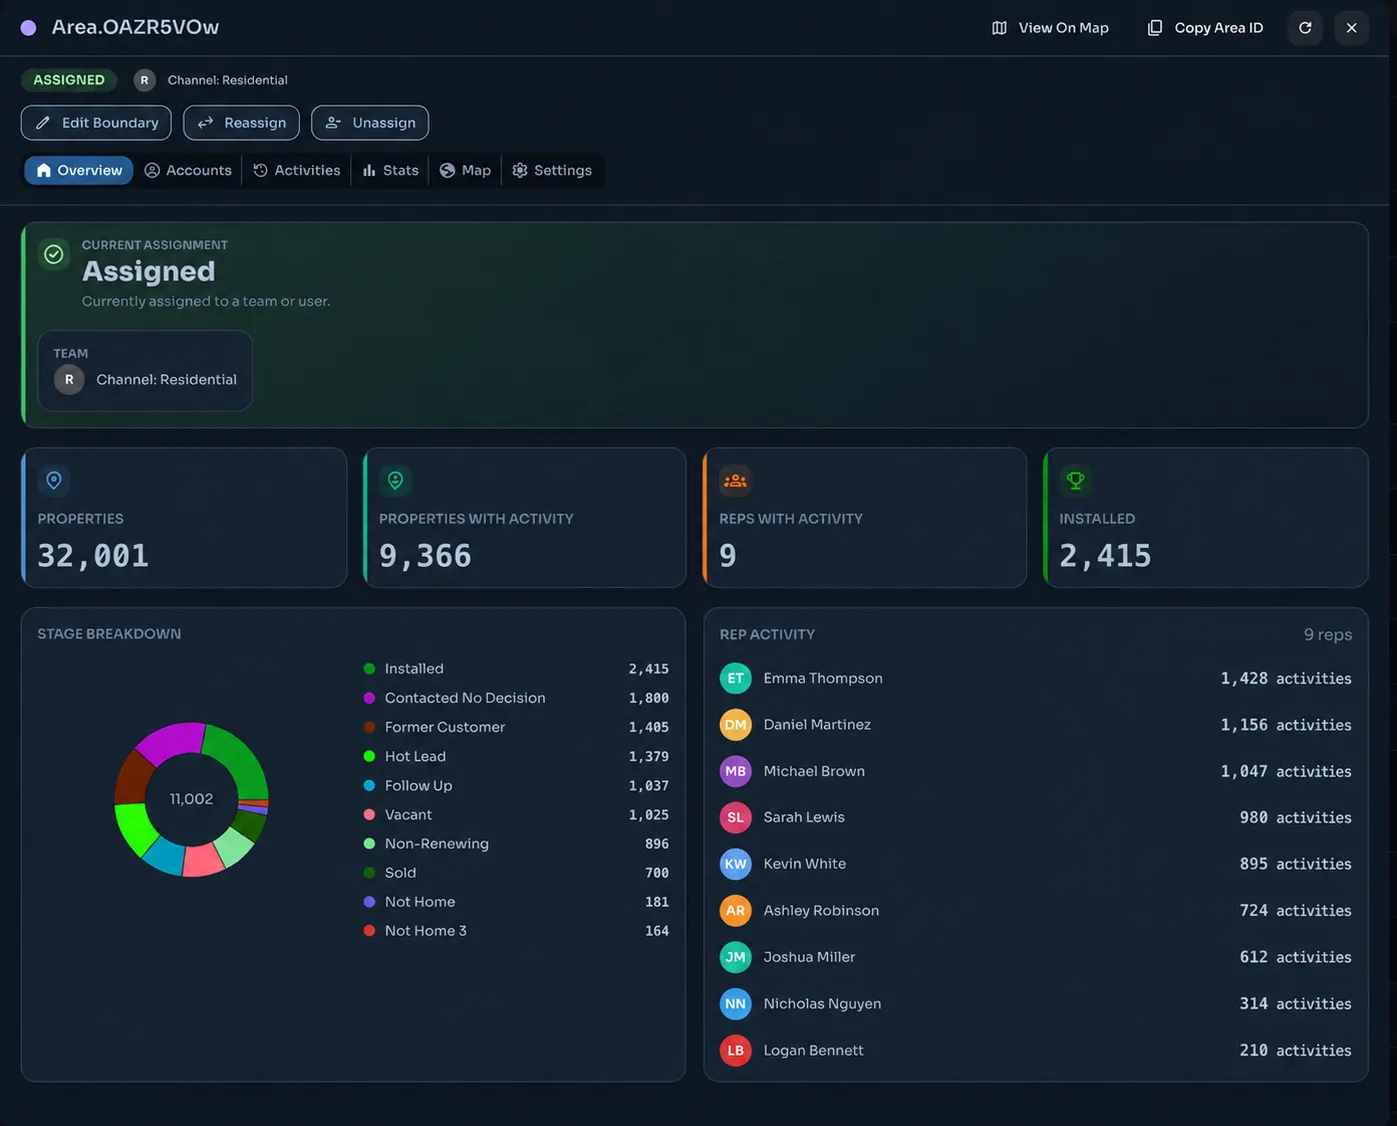
Area scorecards show worked versus untouched, street by street, as it happens — not in an end-of-month spreadsheet.

check

Penetration per area, live

check

Worked vs. untouched at a glance

check

Results split by area, team or vendor

check

One-click exports for the ops review

An area dashboard: 32,001 properties, 9,366 with activity and 2,415 installed, with a stage breakdown and activity per rep

Activity

See what actually happened today.

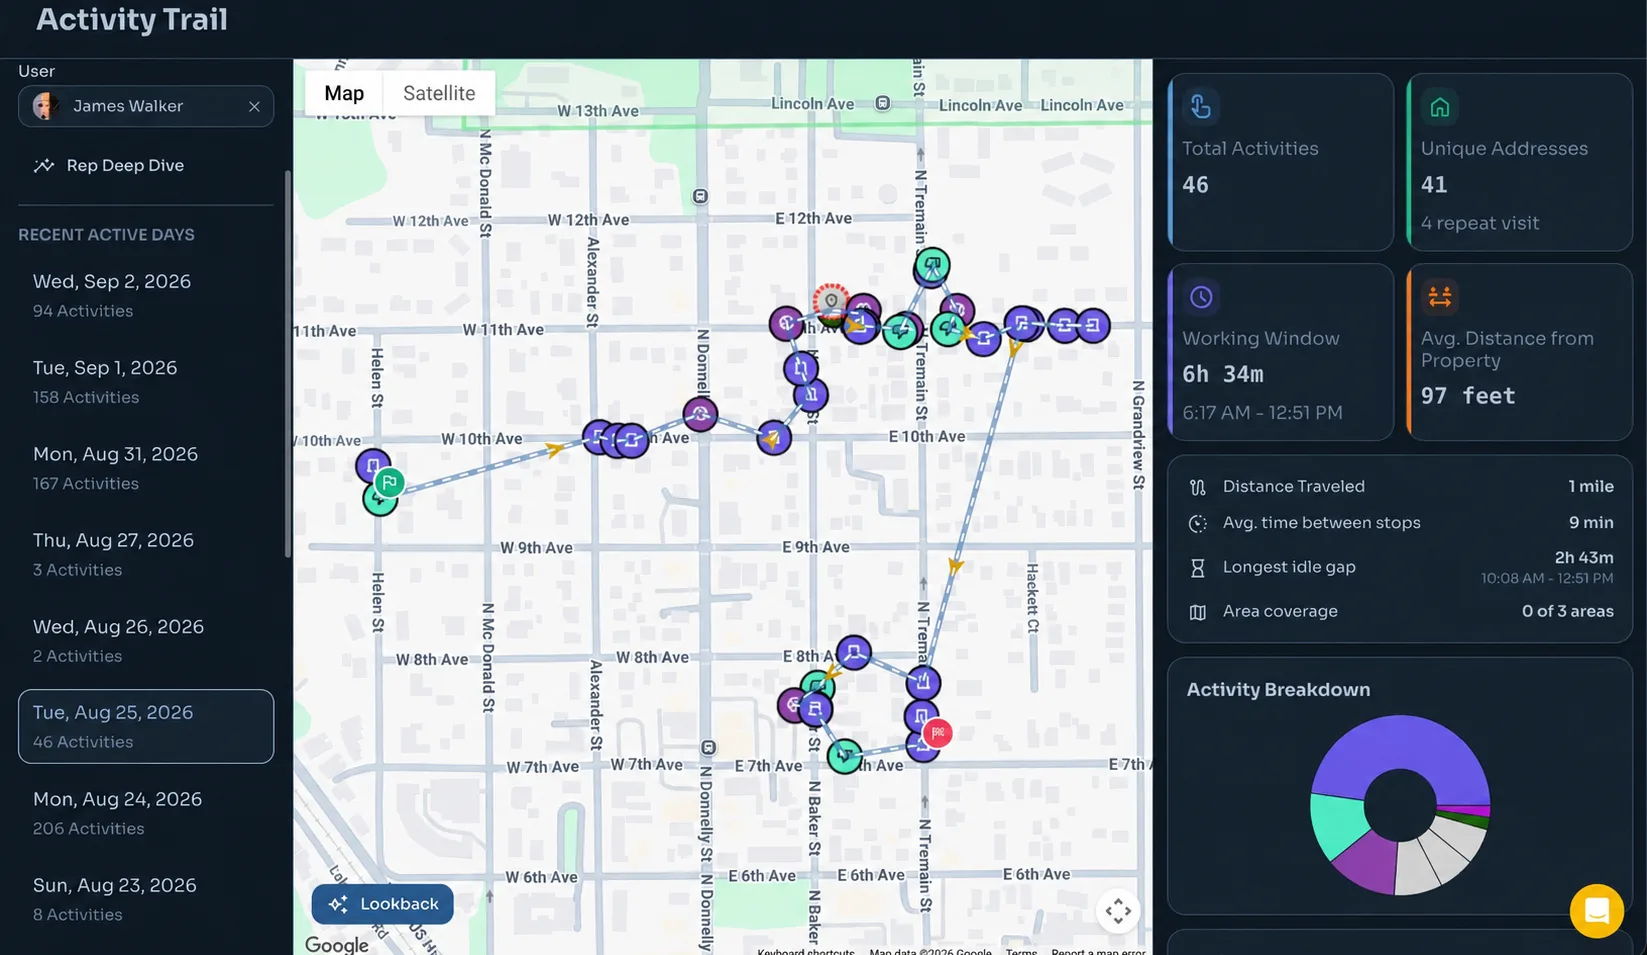
Every knock streams in live, per rep and per team. The activity trail shows the route each rep really walked — visibility you never have to ask for.

check

Live activity by rep, team or vendor

check

Activity trail of each rep’s real path

check

Leaderboards on any KPI

check

Every knock timestamped at an address

A rep's activity trail mapped across a neighbourhood with the day's totals beside it

Also in the box.

draw

Area scorecards

Penetration per area, live.

upload_file

Lead import

Your list, unit by unit.

apartment

MDU support

Every unit its own pin.

cell_tower

Wirecenter overlay

Incumbent operators on the map.

route

Activity trail

Where every rep walked.

wifi_off

Offline mode

Works before the service does.

See it on your own fiber team.

A 30-minute demo, tailored to your size and model.